We Audited 47 Agency Tech Stacks. Here's What Was Quietly Costing Them $24k/Year
Over the past six months we ran free stack audits with 47 agencies. The average team was paying $1,987/month in SaaS subscriptions and losing 6.4 hours per AM per week to context switching. Here's the full breakdown.
Founder & Product Lead · Droova
Over the past six months, the Droova team ran free stack audits with 47 agencies sizes ranging from 3-person studios to 78-person digital transformation firms. The goal: figure out what fragmented tool stacks actually cost agency owners once you add up software bills, integration overhead, and the operational tax of context switching.
The result is the most concrete data set we have on the real cost of running an agency across multiple tools. We're publishing it openly because the numbers surprised us and they'll probably surprise you.
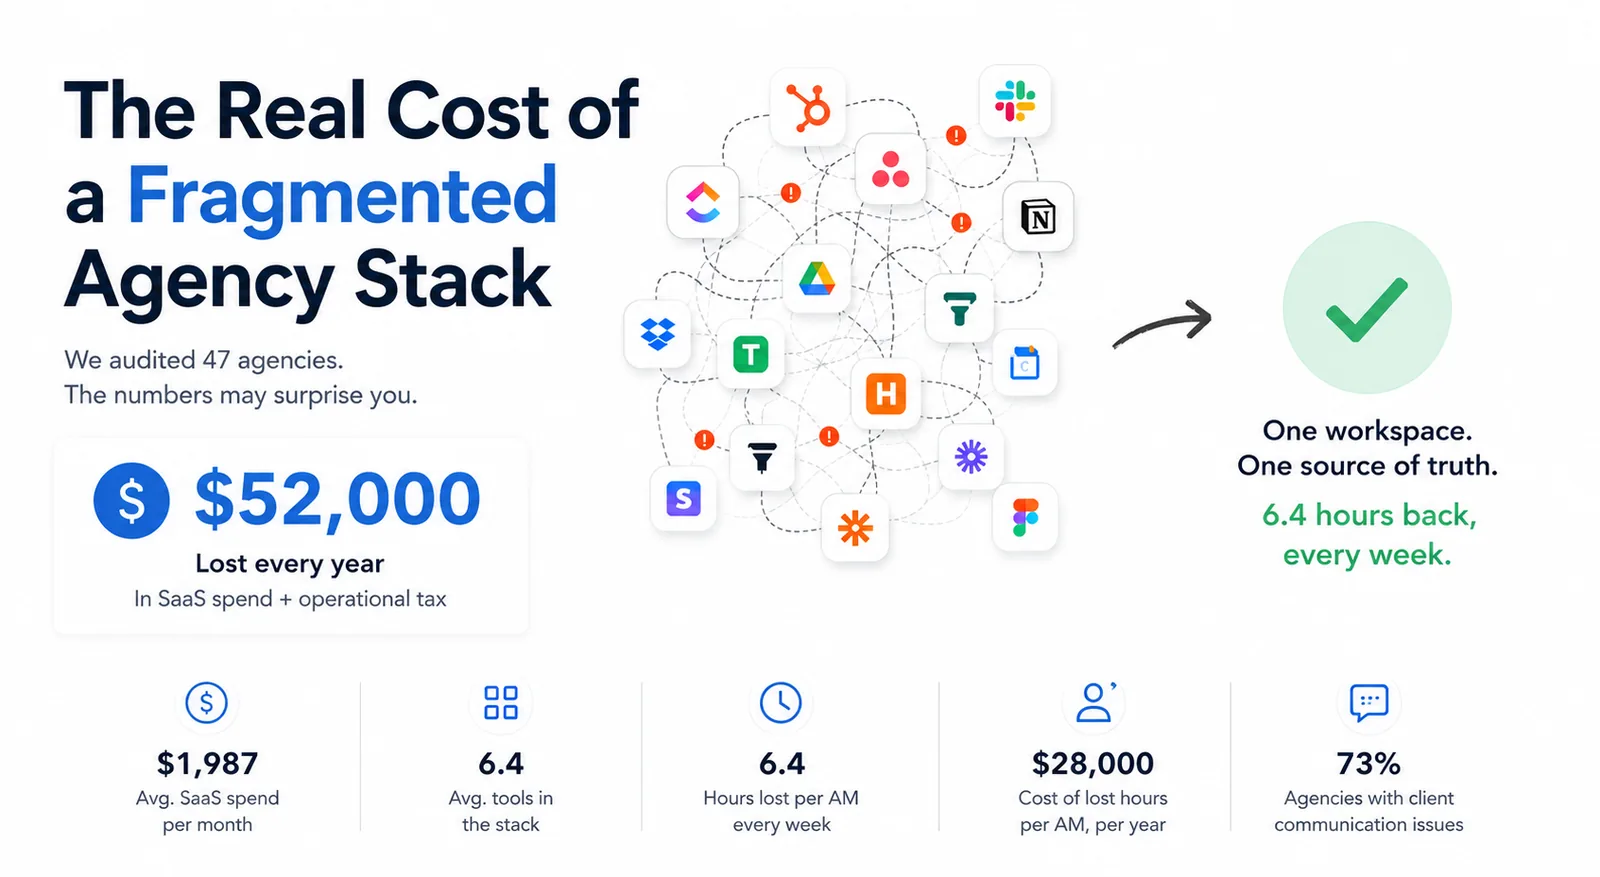
The headline numbers
Average direct SaaS spend: $1,987 per month, or $23,844 per year
Average number of tools in the stack: 6.4
Hours lost to context switching per AM per week: 6.4
Cost of those lost hours (at an average $85/hour blended rate): ~$28,000/year per AM
Agencies where at least one client complained about communication in the last 90 days: 73%
The eye-opener isn't the direct subscription cost. It's the second number: the operational tax is often higher than the bill itself.
The 7 tools that show up everywhere
Of the 47 agencies we audited, here are the tools that appeared in the stacks most frequently:
HubSpot (CRM / pipeline) 71% of stacks. Average bill: $750/month.
ClickUp or Asana (project management) 89% of stacks. Average bill: $225/month.
Slack (internal + client comms) 94% of stacks. Average bill: $120/month.
Google Drive or Dropbox (file storage) 100% of stacks. Average bill: $90/month.
Notion or Coda (docs, wikis, sometimes ad-hoc client portals) 64% of stacks.
Harvest or Toggl (time tracking) 58% of stacks. Average bill: $135/month.
DashThis or AgencyAnalytics (reporting) 47% of stacks. Average bill: $99/month.
Plus a long tail: Copilot for client portals (32%), Calendly (87%), Loom (76%), Typeform (53%), Figma (89%), Stripe (100%), Zapier as glue (62%).
The integration tax nobody quotes
The most overlooked line item: Zapier and other glue tools. 29 of the 47 agencies (62%) were running paid Zapier or Make plans averaging $50/month explicitly to keep their other tools in sync. Five agencies were paying for two glue tools simultaneously because their primary one couldn't handle the volume.
And these integrations break. When we asked "when did a sync last fail or fall behind by more than 24 hours?", 81% of agencies said within the last 30 days. The most common symptoms:
A deal closed in HubSpot but the project never showed up in ClickUp
A task marked done in ClickUp but the client portal still showed it as pending
A time entry logged in Harvest but didn't make it onto the invoice
A new lead from Typeform didn't trigger the welcome email sequence
Each broken sync is an operational micro-fire. Multiplied across 30+ active engagements, fragmentation becomes the dominant tax on the agency's time.
Where the 6.4 hours per AM goes
We asked AMs to log a typical week. The lost time broke down like this:
ActivityHours / wk Compiling and sending weekly client status updates2.1 h Copying data between tools (HubSpot ↔ ClickUp ↔ portal)1.6 h Searching for the "latest version" of files/decks1.2 h Building monthly client reports manually0.9 h Fixing broken Zapier zaps / data inconsistencies0.6 h
None of these activities are billable. None move the engagement forward. They're pure operational overhead the price the agency pays for running its business across 6+ tools instead of one.
The pattern: bigger doesn't mean more efficient
You'd expect that bigger agencies with dedicated ops people and bigger software budgets would have this figured out. They don't. The bottom 10% of agencies (by lost hours per AM) were almost evenly split between 3-person studios and 40+ person firms. The variable wasn't size. It was whether the founder had explicitly designed for consolidation instead of letting tool count grow organically as new needs appeared.
The agencies that scored best had three things in common:
One source of truth per client (not five)
No "Zapier glue" patches keeping the stack alive
A weekly cadence that didn't require manual data assembly
What a consolidated alternative looks like
This data is why we built Droova as an Agency OS rather than another project management tool. Pipeline, projects, white-label client portal, and reporting live in one workspace per client so the 6.4 hours of operational tax disappears. No Zapier. No data copying. No version drift.
If you want to see where your own stack lands relative to the 47 agencies in our data, run the free 2-minute Stack Audit it gives you your annualized cost, your hours-lost estimate, and how you compare to the median. We've kept it free because the data is honestly more useful to us than the leads it generates.
The bottom line
The median agency in our data was burning ~$52,000 per year in combined direct SaaS spend and operational tax. For most agencies that's the equivalent of one full-time junior consultant's salary, going up in smoke every year because nobody had ever sat down and added up the cost of their stack.
It doesn't have to be that way. The fix isn't more tools. It's fewer.
If you run an agency and want a personal audit of your stack with a side-by-side comparison to consolidation, book a 30-minute demo. We'll bring the framework. You bring your stack.
More from the journal
Tactics for running service businesses better - without the fluff.
Browse all posts →